Hello, you are using an old browser that's unsafe and no longer supported. Please consider updating your browser to a newer version, or downloading a modern browser.
Hello, you are using an old browser that's unsafe and no longer supported. Please consider updating your browser to a newer version, or downloading a modern browser.
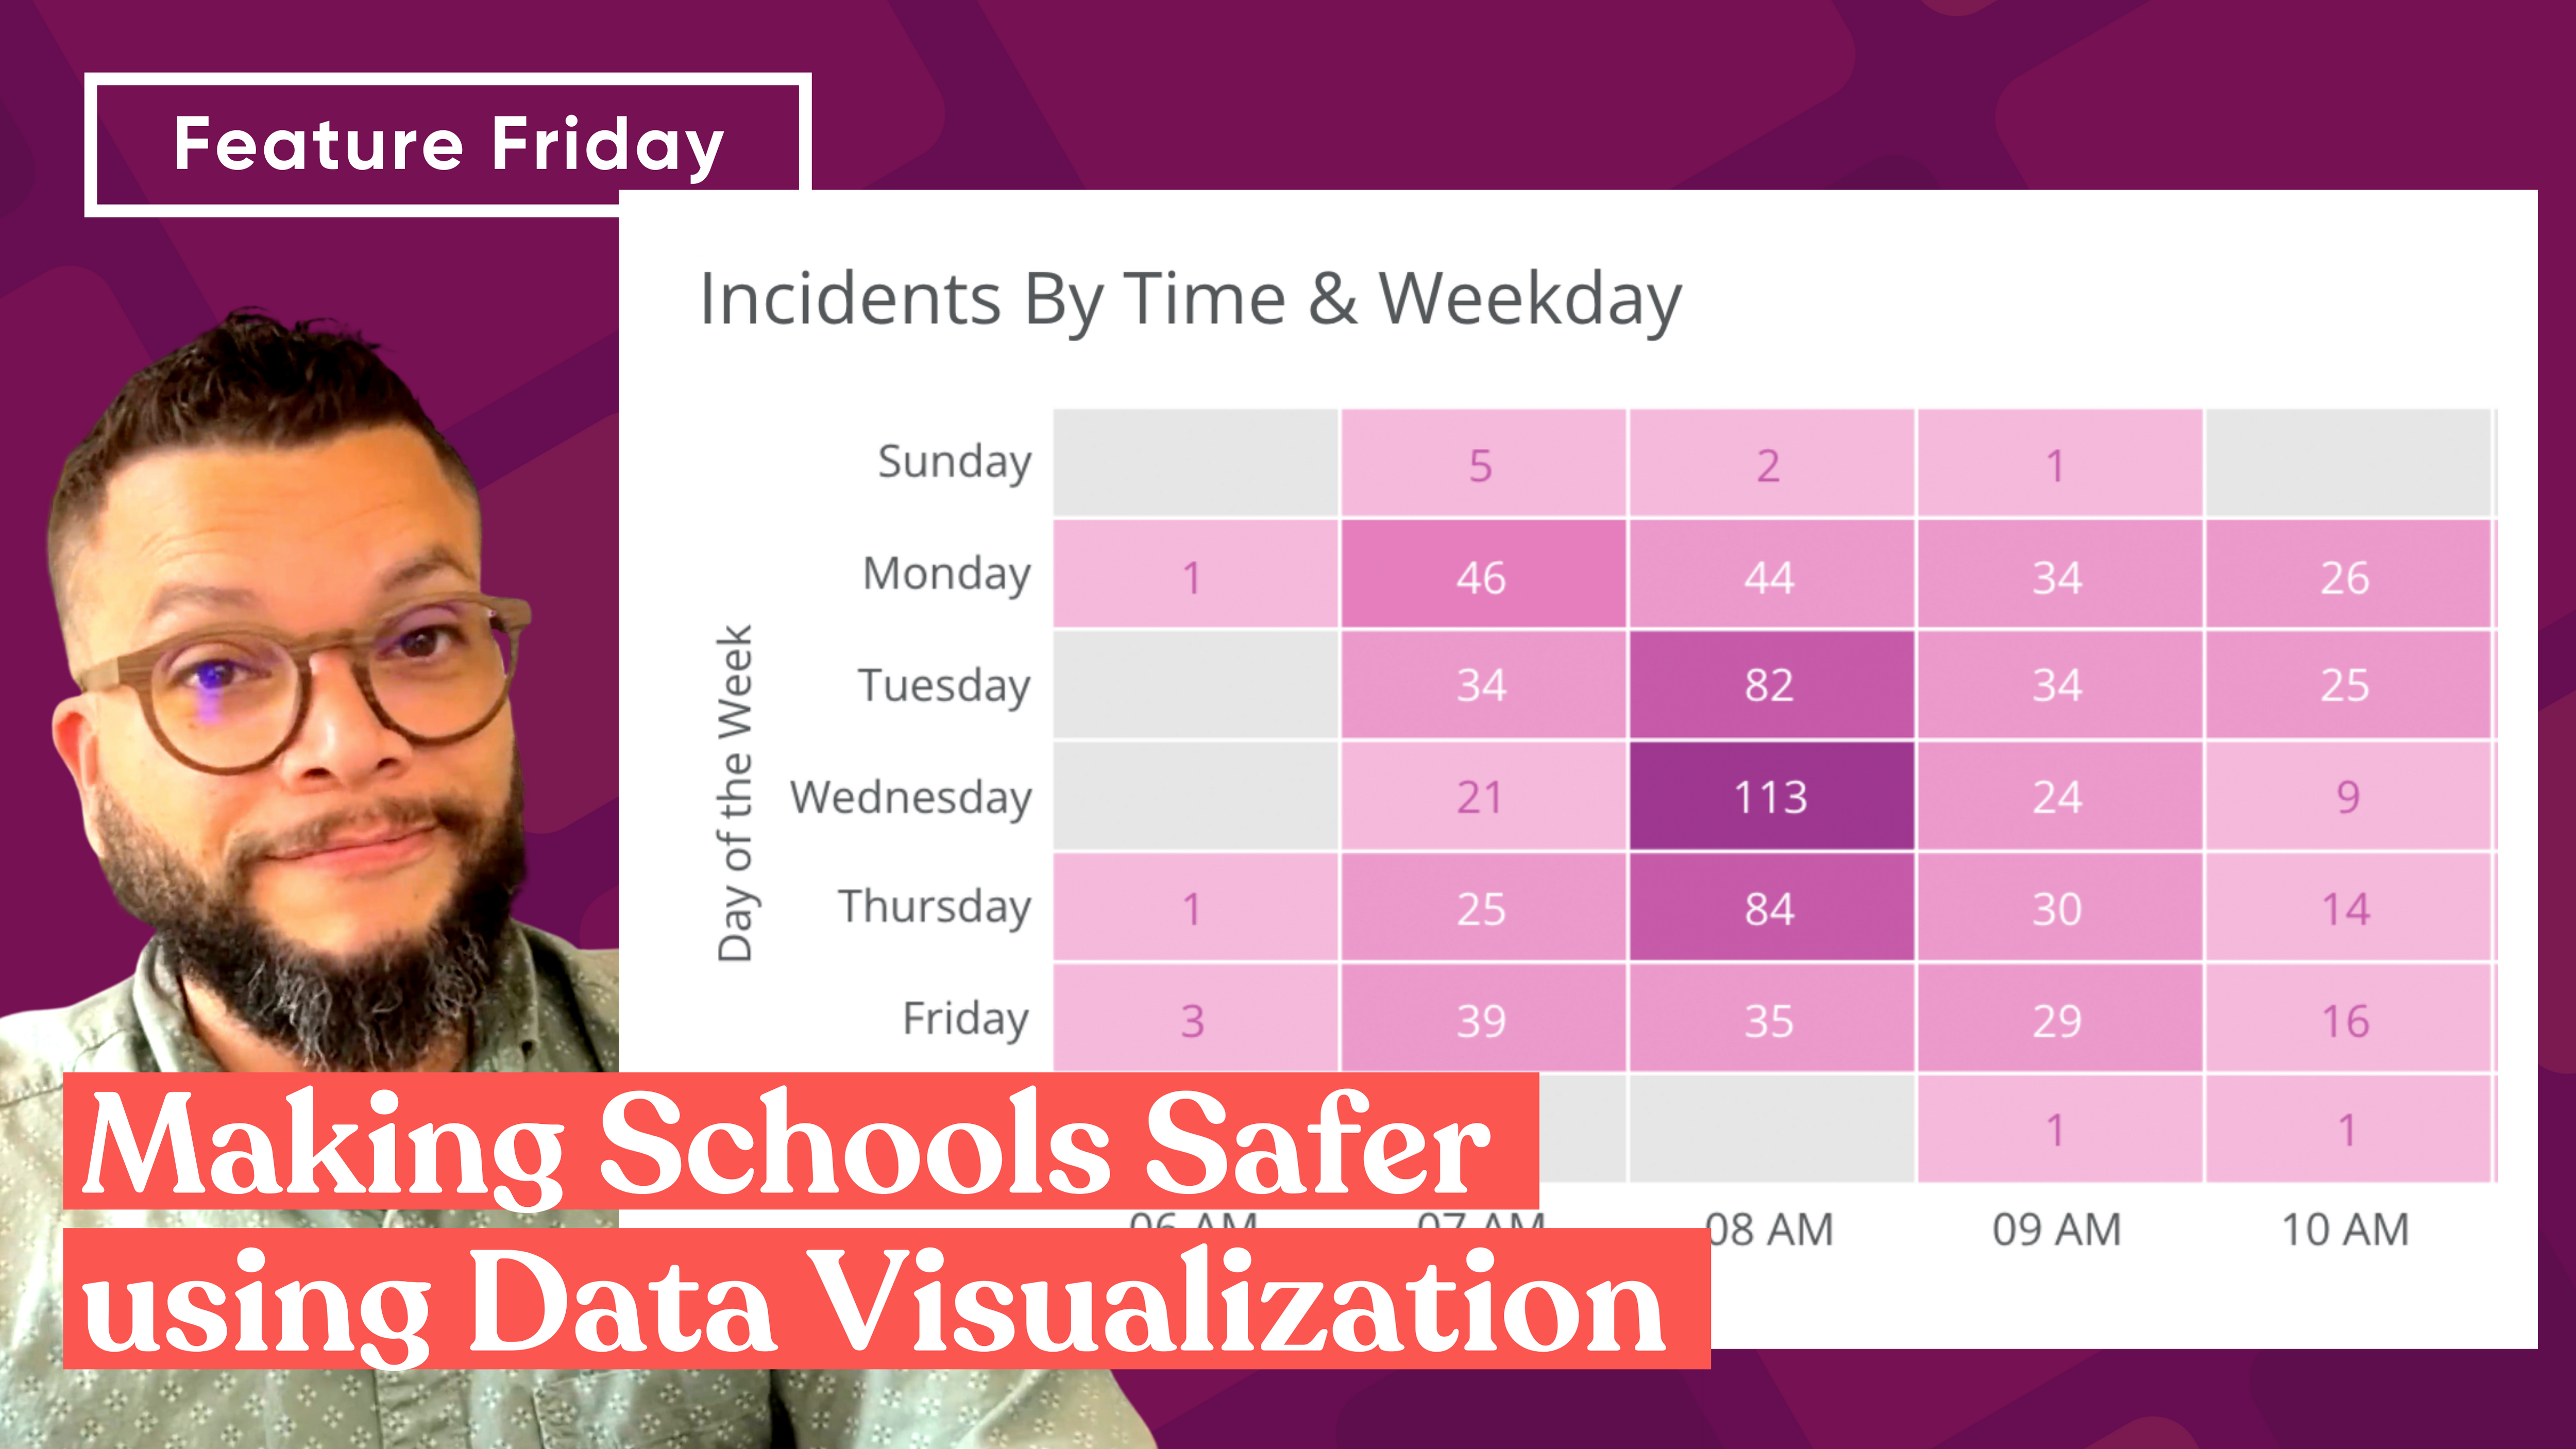
Data visualization can help schools create a safer environment for students and staff. In this #FeatureFriday, we review a set of behavior heatmaps that school leaders can use to target resources and interventions to where they’ll do the most good.