NJ School Leaders Express Dissatisfaction with SIS Data
In an August 2018 survey, NJ school staff rated their level of frustration when retrieving important data from the district’s Student Information System. Did educators feel well-equipped to get information on chronic absenteeism, student growth, and behavior trends?
Unfortunately, the survey revealed a disappointing performance by many of NJ’s commonly-used Student Information System products. Each of the eight systems represented were capable of generating reports for common things like honor roll and attendance, but results suggest most systems are failing to provide analytics that matter to school leaders (with some notable exceptions.)
The appetite for these metrics seems to be growing as school leaders struggle with monitoring multiple measures of student growth. As they work to improve equity, there is also pressure to disaggregate data by key ESSA subgroups like socio-economic status, gender, ELL, and ethnicity.
When asked “What do you wish your SIS could do in the future”, nearly half of respondents (44%) asked for more holistic data on students, which included metrics like:
- Rates of chronic absenteeism
- Rigor of classroom grading practices
- Behavior trends over time
- Meaningful data on student achievement
Majority of School Staff Stuck in Spreadsheets
When asked how effectively they could query the metrics above, 78% felt that data retrieval was impossible, painful, out-of-scope, or only possible using flat spreadsheets or PDF documents.
Only one in four respondents (22%) felt that their SIS was successfully visualizing data efficiently and putting it in an approachable, actionable format.
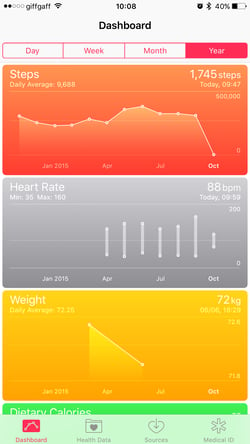
How important is it becoming for SIS products to support data visualization? If the technology in our pockets is any indication, maybe more than ever. Health apps visualize our sleep patterns, step counts, and heart rate. Financial apps put clarifying light on our spending habits or retirement plan investments. Many Student Information Systems, however, still leave their users to fend for themselves in pivot-table purgatory.
Can Analytics Move the Needle on Student Outcomes?
How can a Student Information System affect positive change for students? The team at NJ’s OnCourse Systems for Education offers an audacious take on the role of analytics, which drove them to become one of the first SIS products nationwide to offer integrated data visualization technology.
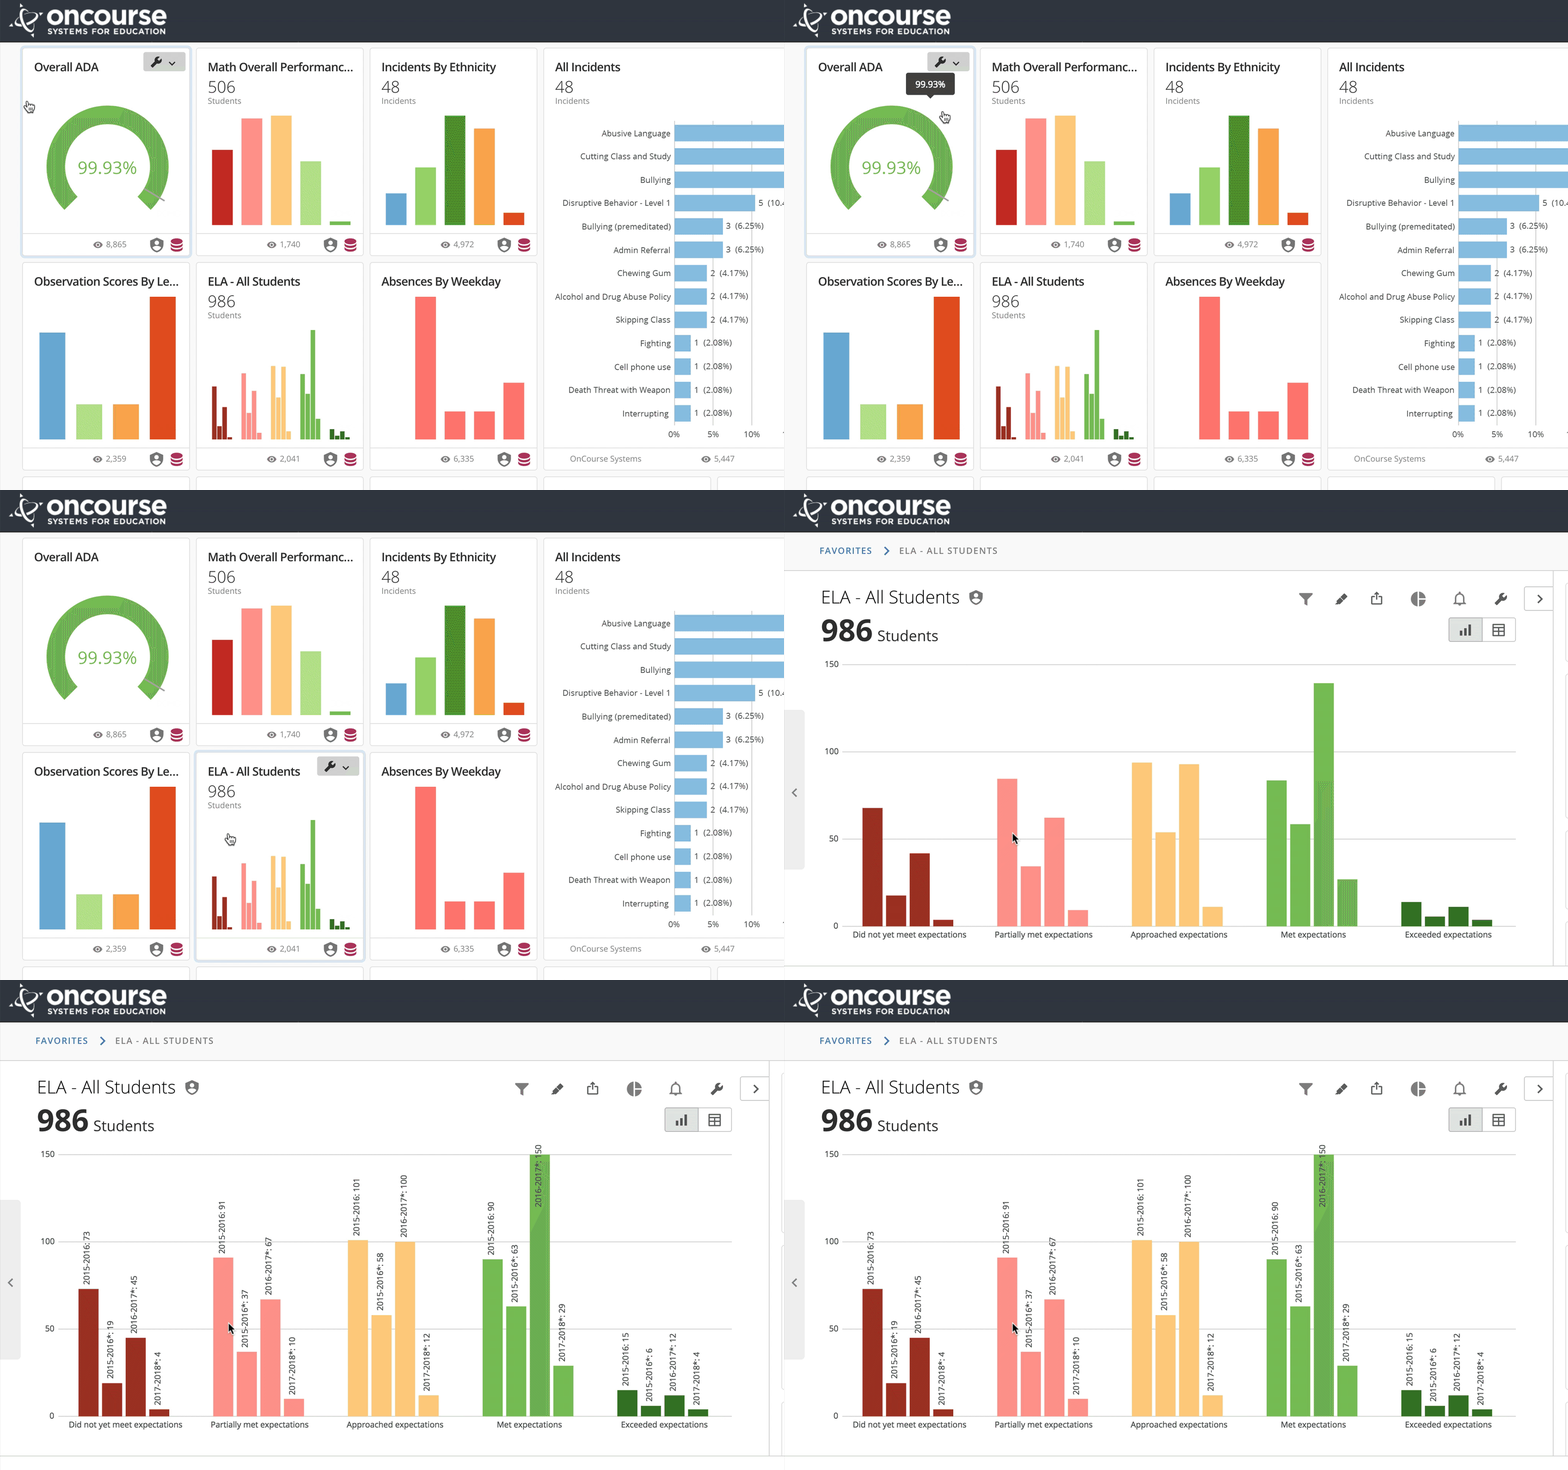
OnCourse offers more than 150 explorable analytics, called “cards”, which offer school leaders an opportunity to drill into nearly every aspect of their school data, like:
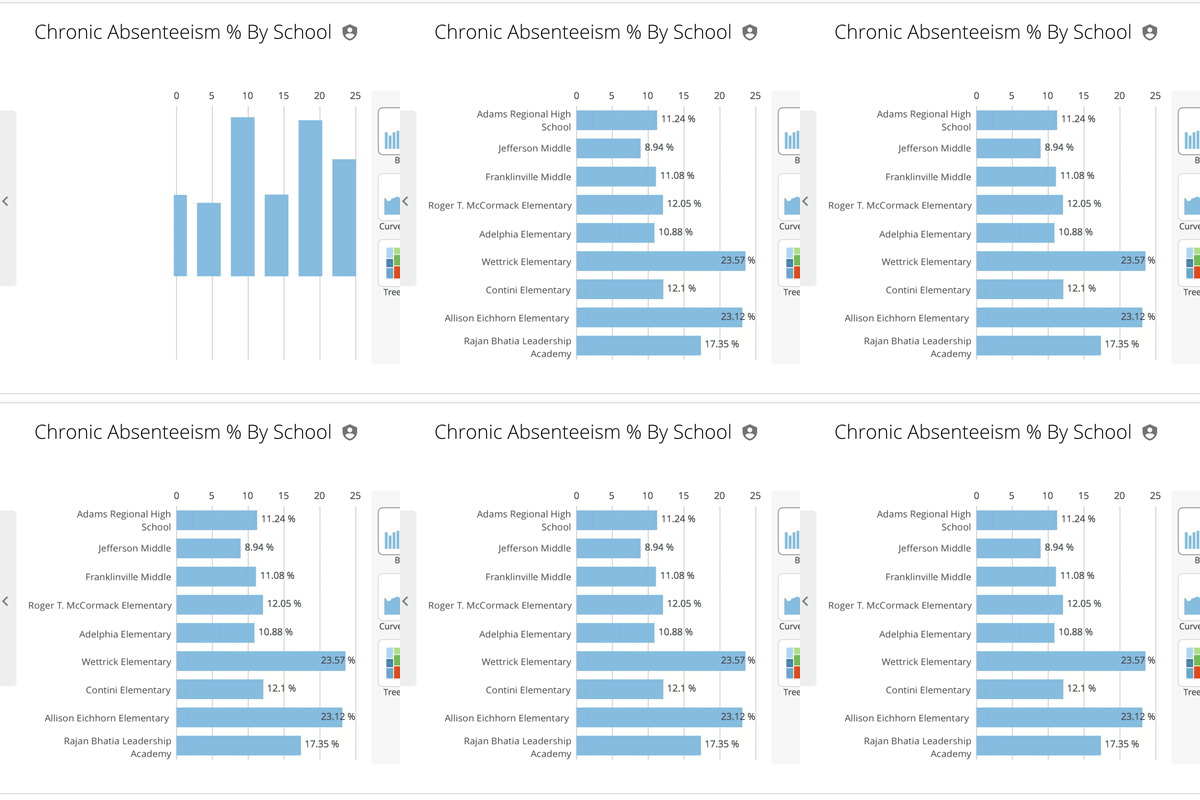
Rates of Chronic Absenteeism
The OnCourse SIS offers an array of analytics for discovering attendance trends, with views of absences by grade level, weekday, and ESSA subgroups (ethnicity, gender, ELL, etc.)
Behavior Trends
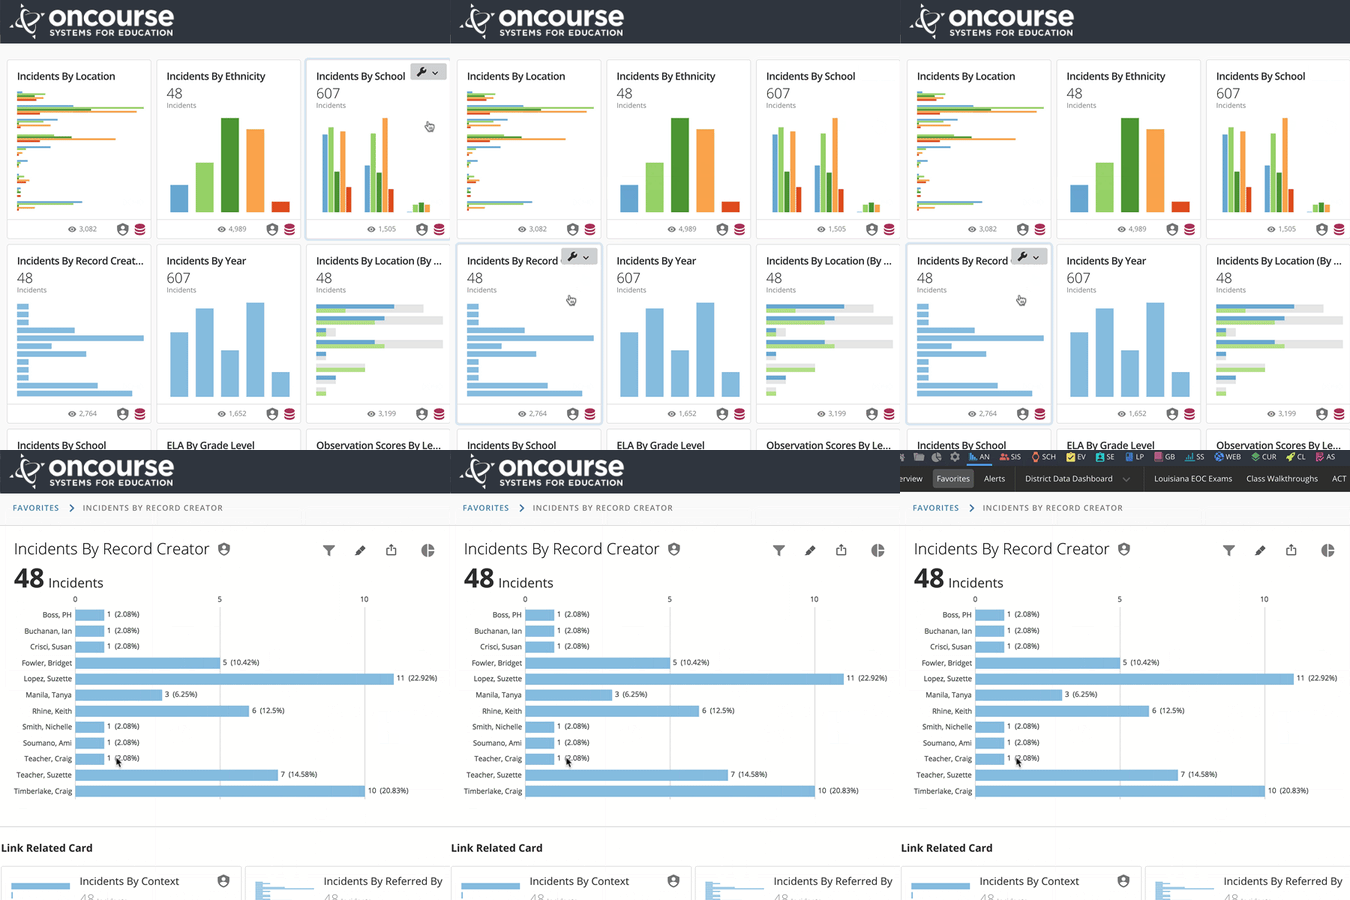
Although most SIS products offer a method for tracking behavior incidents, it’s rare to get great analytics on things like referrals, disciplinary actions, and problem locations. OnCourse now provides administrators with a multi-dimensional look at the district’s behavior profile, with the ability to look at longitudinal trends and summaries by ESSA subgroups.
Student Growth
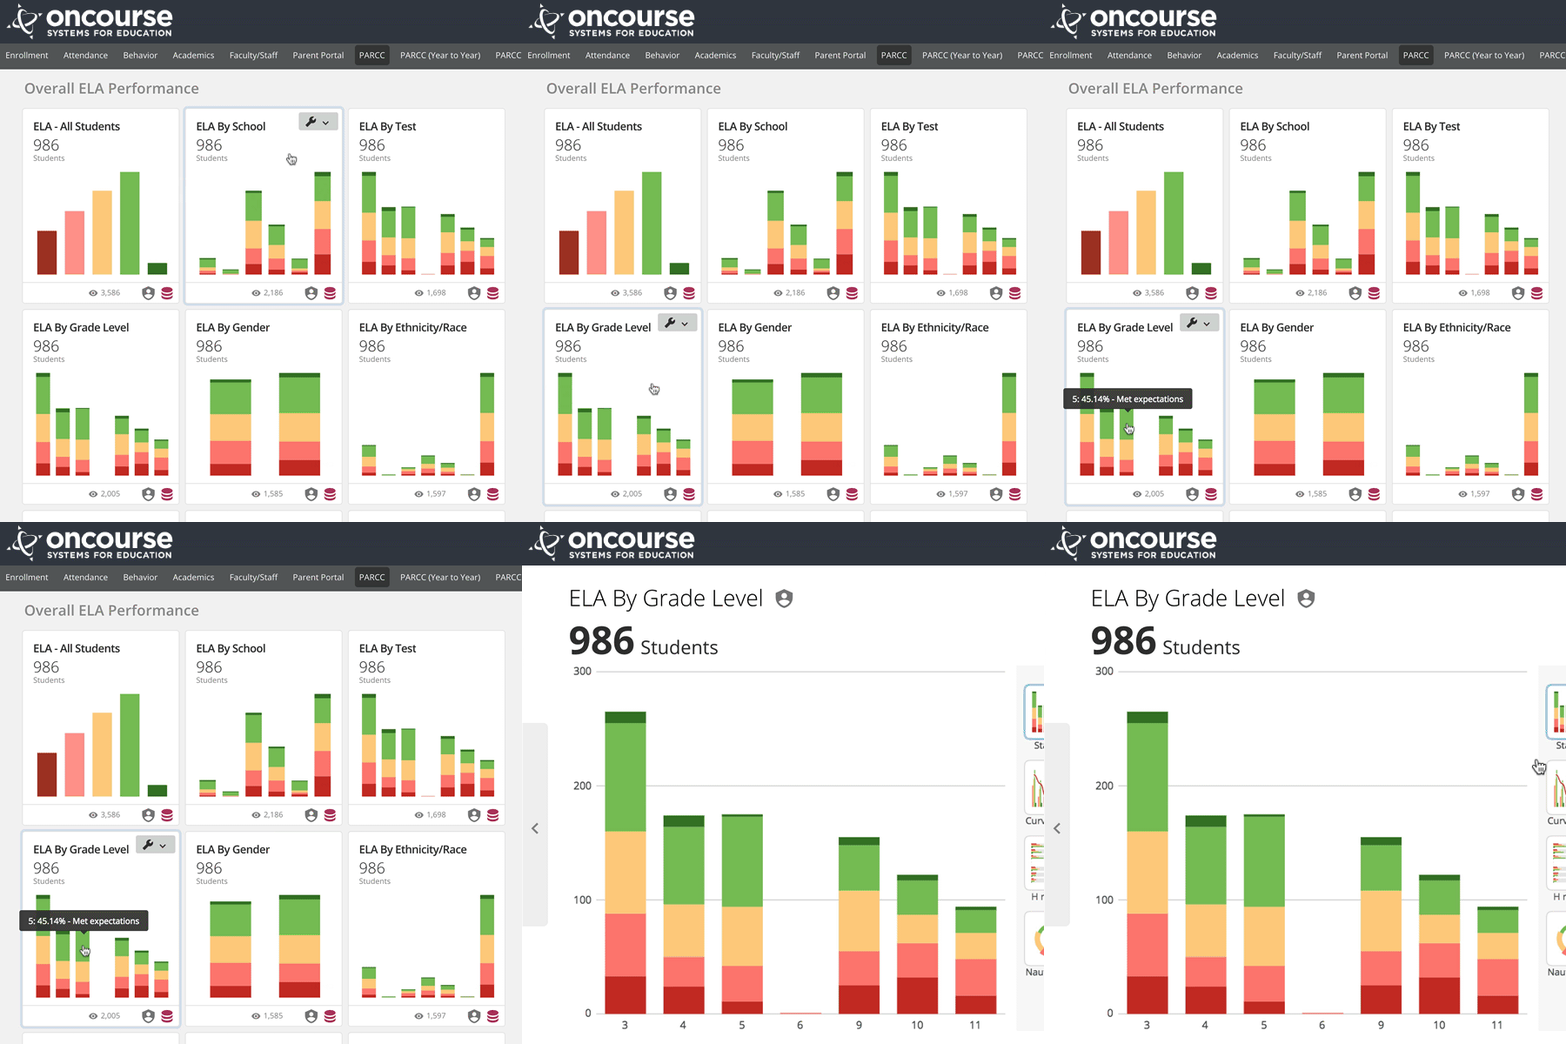
While some SIS products are pivoting toward business administration, others are seizing the opportunity to provide teachers and curriculum staff with actionable data to support student achievement. More SIS products can now serve dynamic data on assessments like PARCC and SAT/ACT, which used to be the domain of data warehouse products.
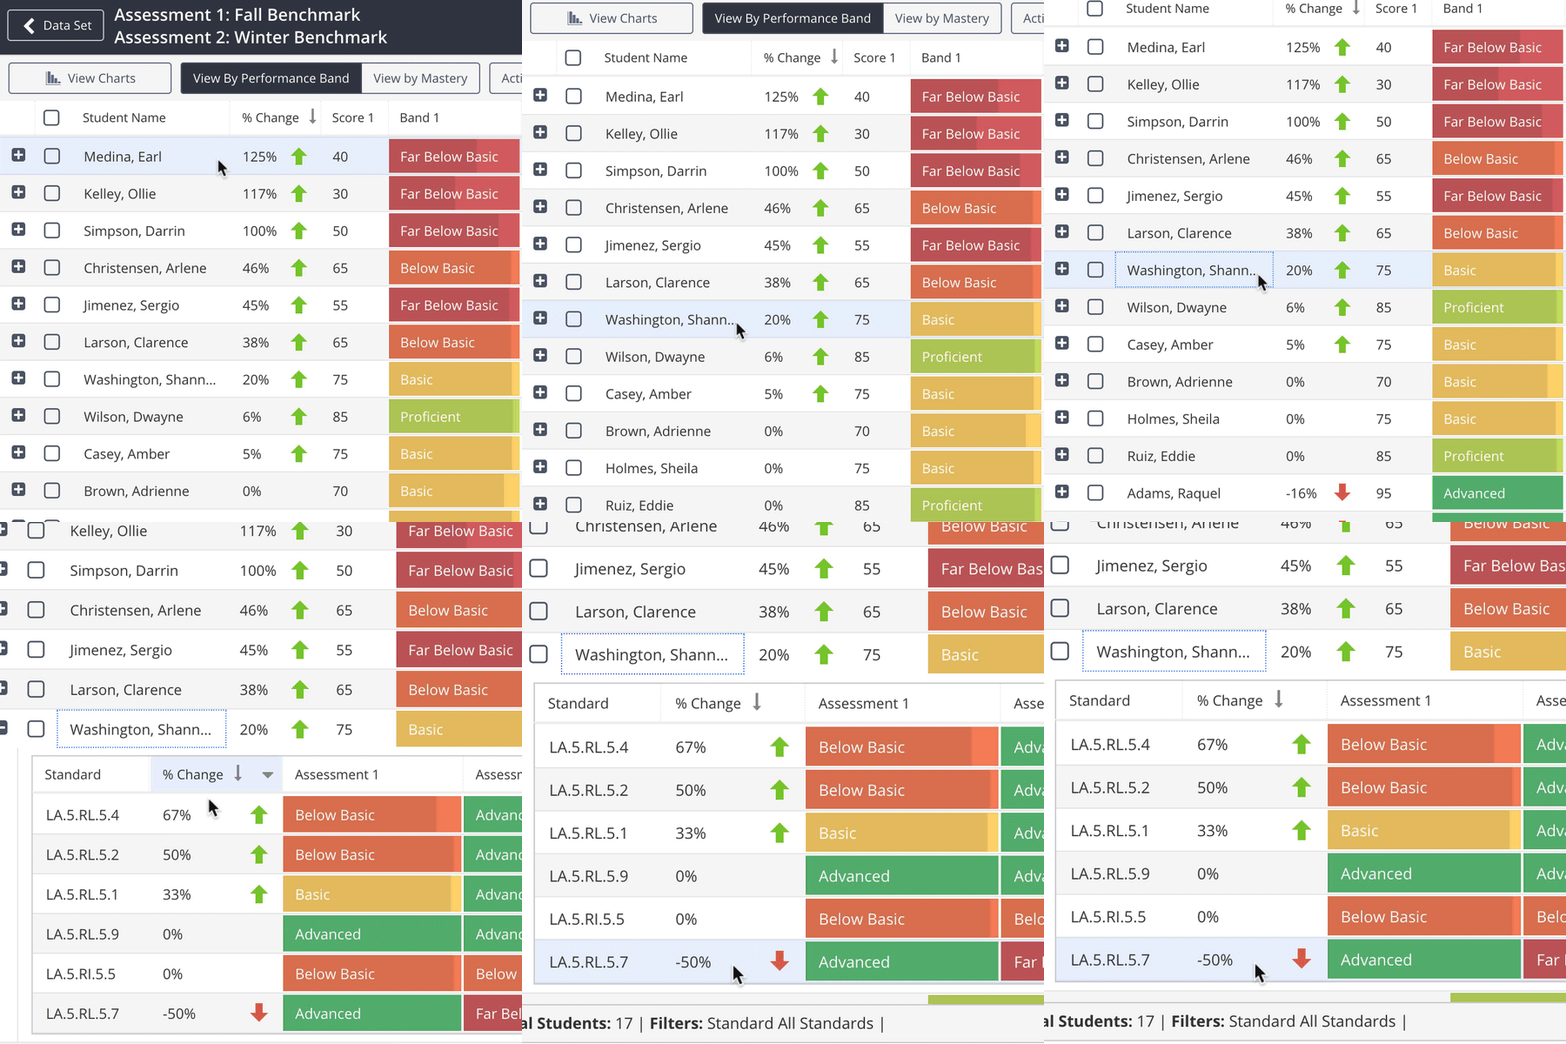
The OnCourse SIS can also be upgraded to include technology-enhanced common assessments which can provide growth data down to the standard.
Curious to know more about OnCourse SIS or Analytics? Contact OnCourse.